Prepared for NATO conference on Kondratieff Waves and Warfare, Covilha, Portugal, Feb. 2005. Published in T. C. Devezas, ed., Kondratieff Waves, Warfare and World Security. Amsterdam : IOS, 2006. Also online here.
Abstract : My work in the mid-1980s on Kondratieff waves tried to explain long waves in terms of causal relationships among six main variables : war, production, prices, innovation, investment, and real wages. I emphasized war as a central element ; saw production waves as leading war/price waves by roughly 10-15 years ; and saw war, innovation, investment, and possibly real wages as mutually reinforcing mechanisms in the long wave. Based on analysis of historical time series, in 1989 I elaborated a four-phase dating scheme based on the lagged correlations among variables, and discussed the phase of the world system (as of 1989) in terms of that scheme. In this paper I revisit these conclusions fifteen years later and find they had strong predictive power regarding the transition in the early 1990s from the “stagnation” quarter-phase of the K-wave to the “rebirth” quarter-phase (higher production growth and investment, low prices, high real wages, high innovation, and low great-power war). All these variables in the late 1990s fit the expectations of the K-wave scheme, especially the relative peacefulness and low military spending in contrast to the previous phase. Looking forward, changes since 9/11 may signal the onset of a new Kondratieff phase, “expansion.”
Introduction
Kondratieff waves, or long waves, of roughly fifty years’ duration have long interested scholars of society and economy, but have proven elusive to confirm or refute empirically. In this paper, after an absence of more than a decade from the field of long wave research, I revisit the subject to see how projections made in the late 1980s compare with outcomes in the past fifteen years. Rather than a full-scale research project to analyze the current economic and political climate in terms of the projected long-wave phases, this paper represents just a simple opening of the issues and examination of a few basic time series for the United States.
1. Dynamics of Kondratieff Waves
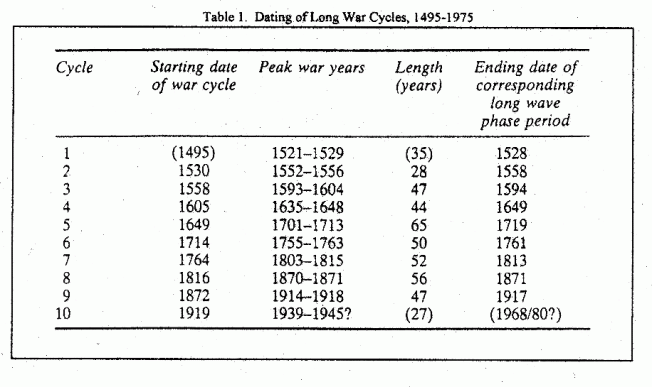
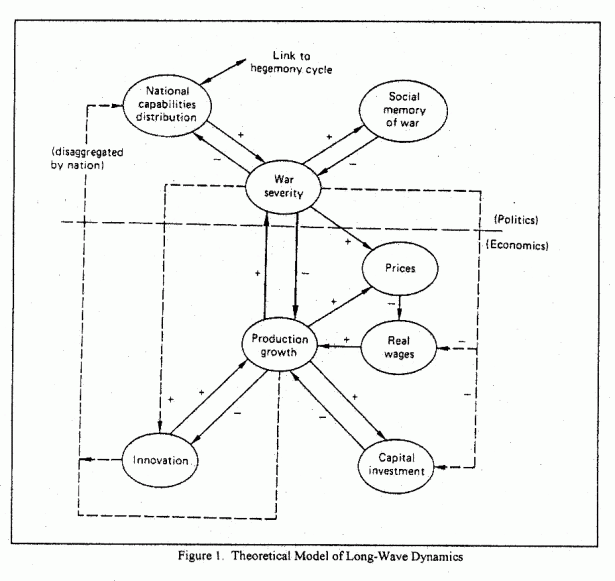
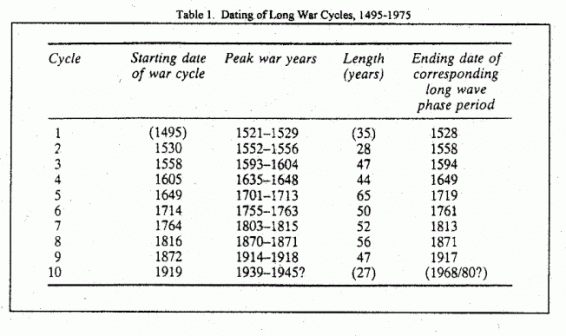
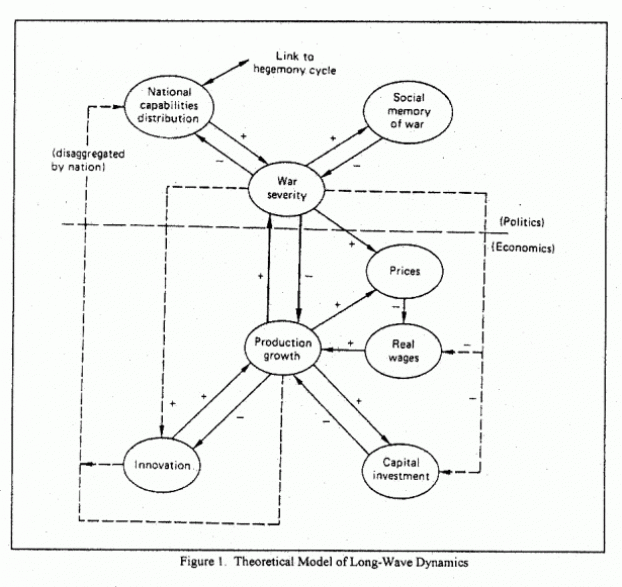
My work in the mid-1980s on Kondratieff waves showed that while authors disagreed completely about the causal mechanisms of such waves, they largely agreed on datings of up and down phases. This consensus was anchored in the strongest and most visible variable – prices – which showed periodic spikes across several centuries. I noted in 1985 [1] that these spikes closely correspond with large great-power wars (see Table 1, from 1989 [2]). Through analysis of dozens of historical economic time series and data on great-power wars, I adduced causality in both directions between war severity and economic variables (see Figure 1, from 1988 [3]). In particular, large wars trigger inflation short-term and drain economies long-term, but economic problems in turn constrain large wars.
In 1989, at an International Economic Association conference, I elaborated a more detailed long-wave schema based on Vector Autoregression (VAR) analysis of long-term time series [4]. The VAR results generally confirmed my adduced causal relationships among six main variables : war, production, prices, innovation, investment, and real wages. I emphasized war as a central element and saw production waves as leading war/price waves by roughly 10-15 years (i.e. about a quarter-cycle). I saw war, innovation, investment, and possibly real wages as mutually reinforcing mechanisms in the long wave. Based on the lagged correlations among variables, I developed a four-phase dating scheme and discussed the phases of the world system in terms of that scheme. Table 2 (from 1989) reproduces my hypothesized historical timing scheme in terms of these four phases.

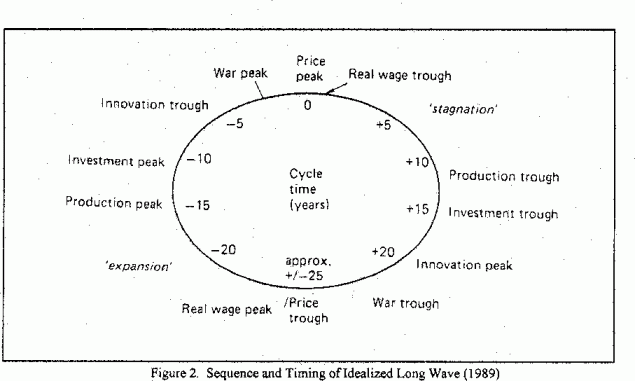
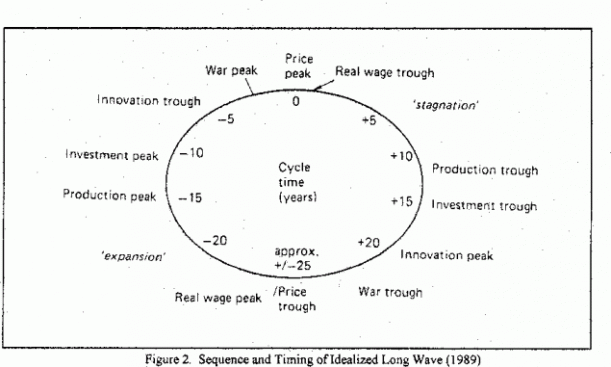
Beyond the four phases, I proposed a sequence of variables based on analysis of lagged correlations among variables. Figure 2 (from 1989) illustrates the adduced sequence and timing of these long-wave variables. The last known date in Table 2 is the price peak (at the top of Figure 2) of 1980.
2. Projections in 1986-89
Looking forward, moving clockwise around Figure 2, I projected that an upturn in production, marking a change from the “stagnation” quarter-cycle to the “rebirth” phase, would be the next development, perhaps starting in the mid-1990s (I would now say 1992). Specifically, the “stagnation” phase (running from 1980 to 1991) was defined as follows : “production growth is low and uneven ; investment is low ; war severity declines ; inflation is low (or prices even decline) ; innovations begin rising ; real wages fall.” The subsequent “rebirth” phase starting by the mid-1990s was defined thus : “production growth picks up again, investment follows ; prices are low ; war severity is low ; innovation is high ; real wages are high.”
During that rebirth phase, according to my theory, great-power war and military spending would continue a downward trend that I dated from the late 1970s, while inflation remained in check but production growth accelerated. Barron’s magazine in 1988 subtitled an interview, “Joshua Goldstein Looks to the Nifty ‘90s.” These projections of an upcoming phase of prosperity and peace ran counter to the short-term trends and conventional wisdom in the late 1980s. President Ronald Reagan had reversed the post-Vietnam trend by sharply increasing military spending, while “Cold War II” had replaced an earlier period of détente. These trends were “counter-cyclical,” I wrote [5].
The idealized long wave scheme in Figure 2 was not intended to track long-wave phase timing exactly, but in fact it tracks quite well. Taking literally the timing of the sequence shown in Figure 2, we may set the “price peak” at the top to 1980 – the last firm point of reference at the time of writing in the late 1980s. The price peak indicates the end of a phase of higher inflation and, historically, a period of price deflation (as between the World Wars), or in recent times a period merely of lower inflation. At the same time, the real wage trough indicates a rising trend in real wages (which reflect inflation inversely).
About twelve years into the cycle, or 1992, would be the production trough, indicating a pickup in the pace of production growth after a long sluggish period. In 1995, the investment trough marks a similar upturn in investment, and around nineteen year after the price peak, or 1999, innovations peak and begin a period of either decline or slower growth in innovation.
Finally, out around 21 years into the cycle, or 2001, the war trough indicates a new upturn in military spending (historically an upturn in great-power war severity). The price trough (ending a half-cycle of low inflation) would come at “+/- 25’ years, around 2005.
3. The Record since 1989
Although fifteen years is not long in the context of a cycle of roughly 50-year cycle, it is long enough to follow the cycle around at least a quarter of the way, moving from one quarter-phase to the next. Ideally one could examine a number of indicators for the variables of interest in my long-wave model, aggregated to cover the core of the world system (i.e., the industrialized countries in economic matters and the great powers in military ones). However, as a start I have simply taken three readily available indicators for the United States, for the three most important variables in my long-wave model – war, prices, and production. As the leading “core” country and dominant military power, the United States probably moves in the same direction as the core of the world system overall (though this could be debated). Given more time, and a research grant, someone could put these questions to better empirical tests. But these series should provide a useful first cut.
3.1 War
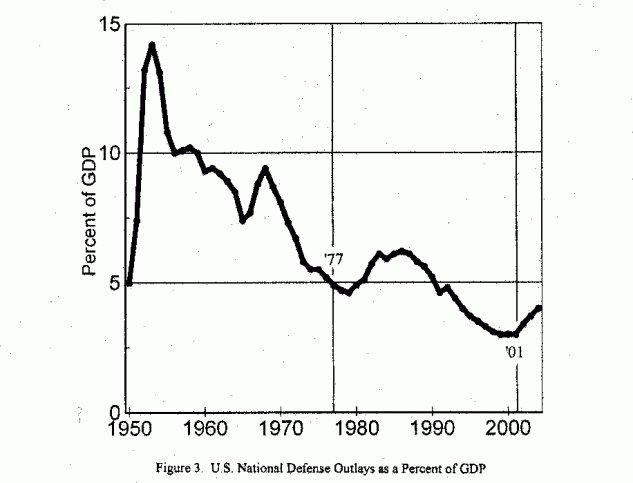
The variable for battle deaths in great-power wars may have become obsolete in the sense that since soon after the invention of nuclear weapons, great-power conflicts have not played out on the battlefield directly. Rather, for decades a “cold” war, which did not involve wars between great powers, exerted similar economic effects through the ongoing mobilization of a wartime economy. Therefore military spending seems a more useful indicator, and indeed when I used the battle-deaths measure for past centuries, it was largely as an instrumental variable to reflect military spending (data for which were unavailable). For present purposes, I graph in Figure 3 the percent of GDP devoted to U.S. national security spending as defined by the U.S. government [6].
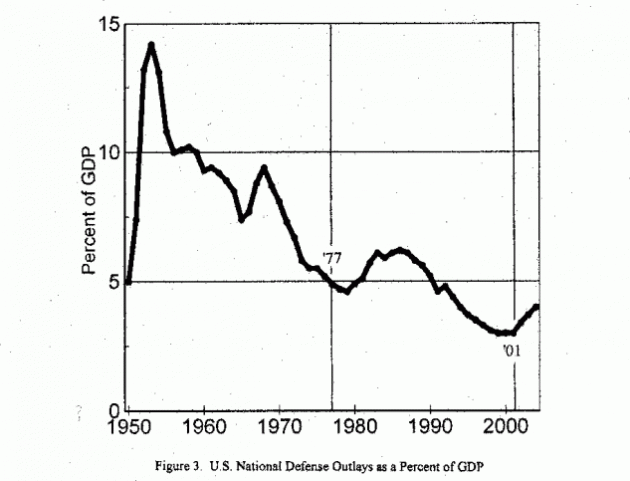
According to my long-wave sequence, sometime around 1977 should have marked the end of a war upswing period and the start of a downswing to last until roughly the turn of the century. The interesting thing about the projection in the late 1980s is that U.S. military spending had recently reversed a long trend of decline and risen somewhat (even as a percent of a rising GDP). The long-wave model projected a renewed downward trend, and that is what actually occurred (Figure 3). In terms of U.S. military spending, however, the 1977 date would seem somewhat late. (The 1940-80 war upswing has always been problematical in my scheme because of the huge war right at the start).
In terms of long-wave timing, the new upturn in U.S. military spending since 2001(see Figure 3) is worrisome, as it could signal the starting gun for a new long-term upswing of rising military spending, an upswing that could even culminate in another ruinous great-power war in the coming decades.
3.2 Prices
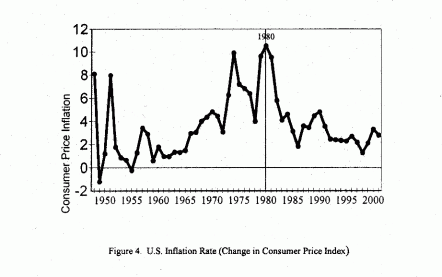
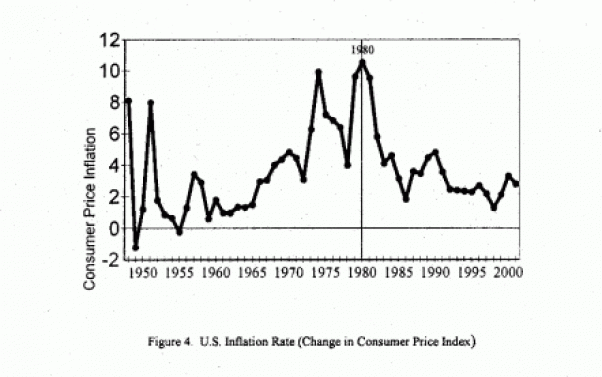
Figure 4 shows the U.S. consumer price index over the past fifty years [7]. The price peak of 1980 is evident. But in the late 1980s, the period of low inflation had lasted less than a decade and had just seen a rise from 1.8 percent in 1986 to 4.5 percent in 1989. The long-wave sequence, however, projected at least a decade more of low inflation, and indeed it has remained low since then (and right up to the present). However, after 25 years of low inflation, we are now due for another long-wave price upswing.
3.3 Production
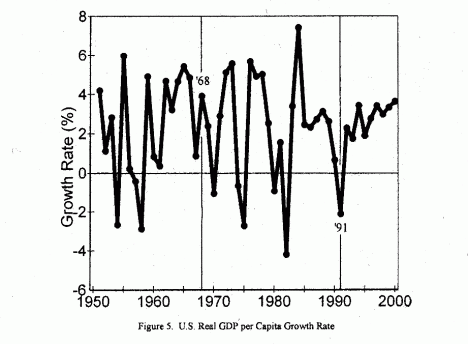
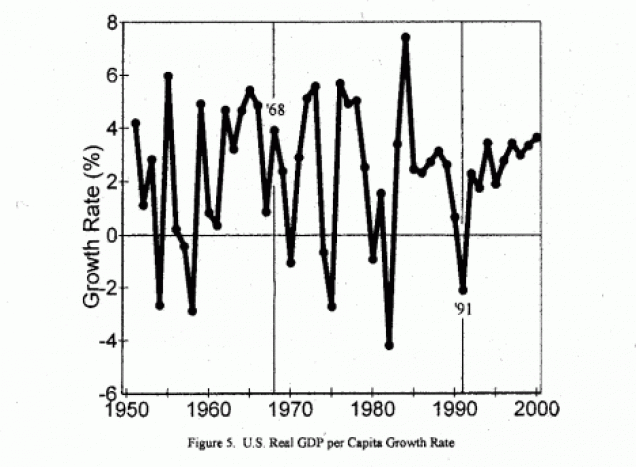
I am not sure how best to measure production – in my earlier research I used several scholars’ long-term production indexes – but the growth of Gross Domestic Product (GDP) seems a good measure to start with. The Penn World Table [8] provides GDP data adjusted for purchasing-power parity. In Figure 5 I have graphed the growth rate in the U.S. GDP per capita, adjusted for inflation.
According the long-wave sequence, the phase from 1969 to 1991 should be characterized by slow and uneven growth, then the period since 1991 by more robust growth. What one sees in the data is not so much a slowdown and then speed-up of per capita GDP growth, but rather a greater volatility and then stability. During the nominal production “downswing” of 1969-91, ever-lower valleys and ever-higher peaks alternate rapidly). Then in the nominal production upswing from 1992 forward, we see a dramatic stabilization of growth rates – around 3 percent a year in real per capita terms – for a solid nine years. I am not sure what to make of this stable period, but it is an interesting change just at the time the long-wave sequence calls for a phase shift in production growth.
4. Looking Forward
Continuing around the bottom of Figure 2, if we tentatively take 2001 as the war trough, then the price trough is upon us, and we can expect inflation to begin trending upward again in the coming years. This would also mark the start of an “expansion” quarter-phase, defined thus in my 1989 paper : “production, investment, war severity, and prices all rise ; innovation is stagnant ; real wages flatten out.” Historically analogous phases could be found in 1893-1910 or (less plausibly) 1940-68. My hunch is that both war and inflation may take quite a few years to build towards a new peak, somewhat similarly to the buildup of tensions before World War I.
If the sequence and timing hold up as exactly in the coming years as in the past fifteen years – and I have no particular reason to think they would, but it makes a good baseline projection – we could expect continued strong GDP growth despite the downturn in 2001 which broke the long period of stable growth since 1992. The production peak that would end the “expansion” quarter-phase might come around 2015. The next phase, “war,” representing the dangerous second half of the long war upswing, could then occur around 2015-2030, with the war peak possibly found in the late 2020s and the price peak around 2030 (fifty years after 1980). In my 1988 book I pointed to the period around the 2020s as a potential danger zone, and it still worries me.
Historically, interest in long waves has waxed and waned, with greatest interest during bad times when the idea of a cycle suggests a brighter future. During good times, interest in cycles diminishes, since a cycle theory suggests that the good times will not last. This, sadly, is exactly the conclusion I draw regarding the good times of the 1990s. I hope I am wrong, but the long wave sequence leads to the depressing thought that the peace and prosperity of the 1990s may be the best conditions we are going to see for decades. I have elsewhere pointed to the dangers of a coming up-tick in inflation as the costs of the War on Terror begin to hit home in the coming years [9]. On the bright side, the war danger that I associate with the 2020s is still decades away, and perhaps tractable as world politics evolves. Meanwhile there could be much economic growth still to enjoy, at least for those with long-term fixed-rate mortgages who will be positioned to ride out a new round of inflation.

